Магазин Приложений
Каждый день на витрине MQL5 Маркета появляются десятки новых приложений для автоматизации торговли. Выберите подходящее среди 10 000 продуктов и избавьтесь от ненужных рутинных операций.
Продавайте свои программы для алготрейдинга в нашем Маркете — в самом большом магазине торговых приложений для трейдеров!
Торговые Сигналы
Выберите подходящую торговую стратегию и оформите подписку на нее в пару кликов. Все Сигналы сопровождаются подробной статистикой и графиками.
Станьте Поставщиком торговых сигналов и продавайте подписку тысячам трейдеров по всему миру. Наш сервис позволит вам хорошо зарабатывать на прибыльной стратегии даже при небольшом стартовом капитале!
London, UK
51.5235, -0.636
New York, US
40.7765, -74.072
Sau Paulo, Brazil
-23.4663, -46.8634
Hong Kong
22.3656, 114.1171
Amsterdam, Netherlands
52.3918, 4.665
Moscow, Russia
55.736, 37.721
Falkenstein, Germany
50.4788, 12.3327
Frankfurt, Germany
52.3918, 4.665
Chicago, US
42.0011, -87.9571
Mumbai, India
19.1131, 72.8925
Johannesburg, South Africa
-25.9305, 28.1362
Singapore
1.3226704, 103.9186452
Работа Фрилансерам
Закажите под свою торговую стратегию технический индикатор, робота или любую другую программу для платформы MetaTrader у проверенных разработчиков.
Профессионалам алготрейдинга Фриланс предлагает сотни заказов, гарантию оплаты за выполненную работу и мгновенный вывод заработанных денег через удобные платежные системы.
Новое в Чатах
Общайтесь с коллегами в чатах, обсуждайте новые идеи в группах, подписывайтесь на полезные каналы и создавайте свои, чтобы делиться опытом


Форум Трейдеров
Задавайте вопросы по техническому анализу, обсуждайте торговые системы и улучшайте свои навыки в алготрейдинге на языке MQL5.
Общайтесь и обменивайтесь опытом на форуме с трейдерами всего мира и помогайте ответами новичкам — наше сообщество развивается вместе с вами.
- Торговля внутри дня, мой подход
- Midjourney и другие нейросети обработки изображений
- Машинное обучение в трейдинге: теория, модели, практика и алготорговля
- Ошибки, баги, вопросы
- Некорректно отображается Русский язык в MetaTrader4
- Точка баланса путь к Граалю .
- Обсуждение статьи "ZUP - зигзаг универсальный с паттернами Песавенто: Графический интерфейс. Дополнения и изменения. Вилы Эндрюса в ZUP"
- Какое время имеют котировки, полученные из терминала MetaTrader 5 через API для Python?
- Любые вопросы новичков по MQL4 и MQL5, помощь и обсуждение по алгоритмам и кодам
- почему заблокировали финансовые операции ?
- Как отменить заказ фрилансеру по соглашению сторон
- Как пройти дополнительную проверку личности?
- Можно ли торговать по тиковым объемам?
- MQL5. Открытие сделки по закрытию бара.
- Скрипты: Widescreenshooter
- Вопросы от начинающих MQL5 MT5 MetaTrader 5
- Индикаторы: ZigZag
- Открытие сделок
- Обсуждение статьи "Разрабатываем мультивалютный советник (Часть 9): Сбор результатов оптимизации одиночных экземпляров торговой стратегии"
- Обсуждение статьи "Разработка системы репликации (Часть 36): Внесение корректировок (II)"
Статьи по торговле на финансовых рынках
Учитесь создавать свои собственные технические индикаторы и торговых роботов по примерам в статьях, написанных для вас другими трейдерами.
Поделитесь своим опытом в торговле и программировании с новичками алготрейдинга — напишите об этом статью, а мы переведём её на 10 языков, да еще заплатим $200!

Разрабатываем мультивалютный советник (Часть 9): Сбор результатов оптимизации одиночных экземпляров торговой стратегии
Разработка системы репликации (Часть 36): Внесение корректировок (II)

Разработка системы репликации (Часть 35): Внесение корректировок (I)

Разработка системы репликации (Часть 34): Система ордеров (III)
Нейросети — это просто (Часть 86): U-образный Трансформер
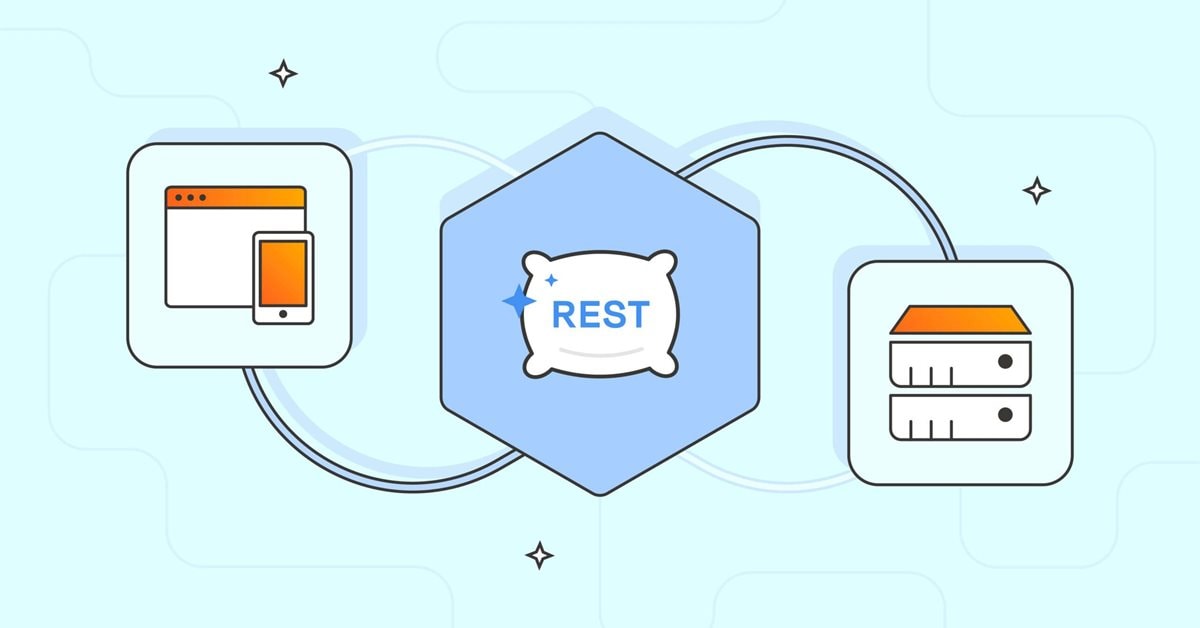
Как разработать агент обучения с подкреплением на MQL5 с интеграцией RestAPI (Часть 1): Как использовать RestAPI в MQL5

Алгоритм оптимизации на основе мозгового штурма — Brain Storm Optimization (Часть II): Многомодальность

Разрабатываем мультивалютный советник (Часть 8): Проводим нагрузочное тестирование и обрабатываем новый бар